USING THE BPI
Each one of the tabs in the navigation bar present a different dimension of the BPI.
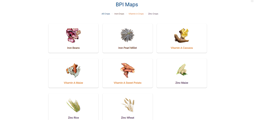
BPI Maps: Allows you to explore and compare global rankings and priority levels for each of the eight biofortified crops. These maps also provide information on countries that have released biofortified varieties of the crop, and countries in which crop testing (which precedes official release) is taking place.
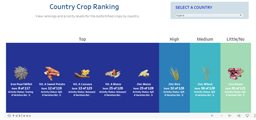
Country Pages: Lets you view results for all biofortified crops, by country, to determine at a glance which micronutrient-crop combinations are best suited for investment in that country.
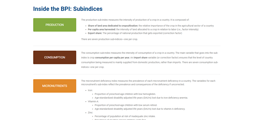
Subindices Maps: Take a closer look at the three indices that go into the calculation of the BPI. View and compare global rankings and priority levels for production and consumption subindices (for biofortifiable crops) and micronutrient deficiency (for vitamin A, iron, zinc) subindices.
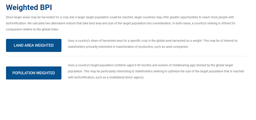
Weighted BPI Maps: View and compare the global BPI rankings and priority levels taking the size of the country—measured by land area or population—into account.